In today’s rapidly evolving tech landscape, access to comprehensive and actionable product data is pivotal for making informed decisions and driving innovation. Punditas AI addresses this need with its innovative Chart View feature, which enhances the user experience by offering a visually intuitive representation of product data.
Understanding Punditas AI’s Chart View Feature
Dynamic Visualization of Data
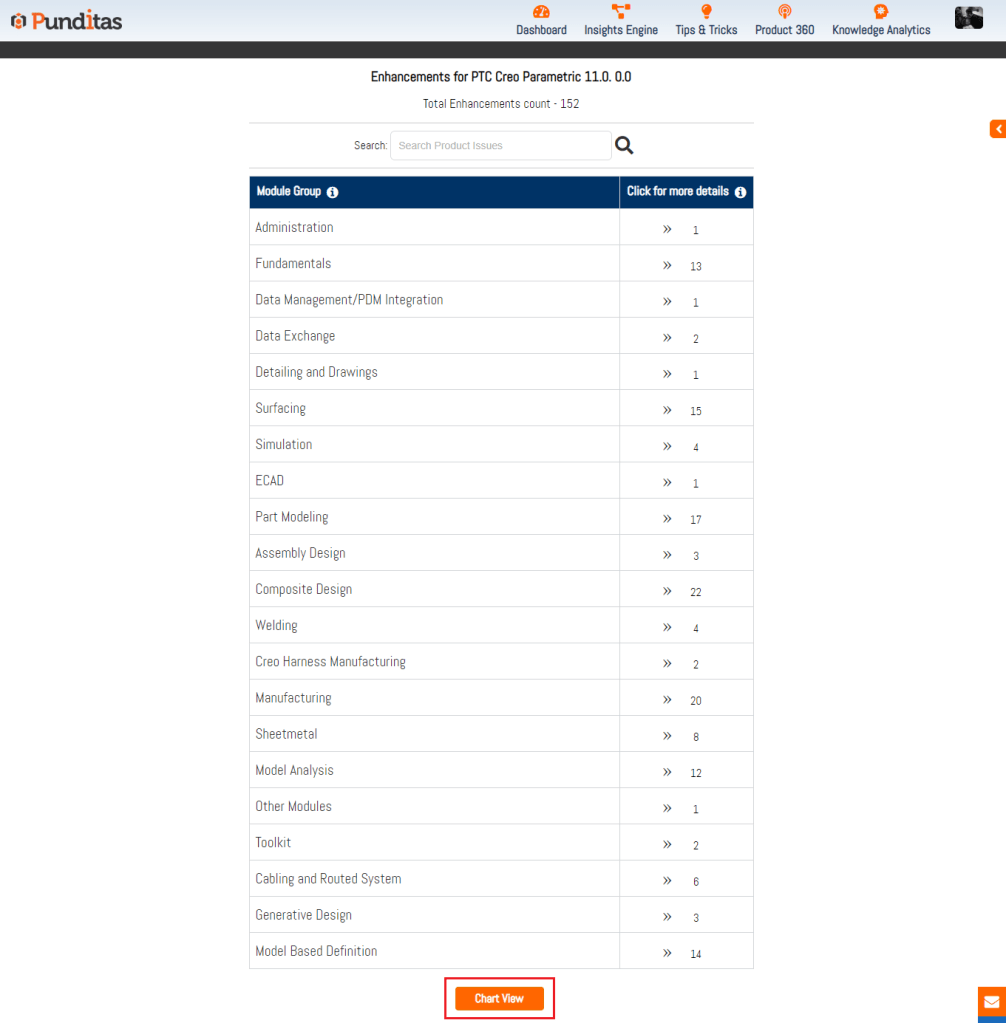
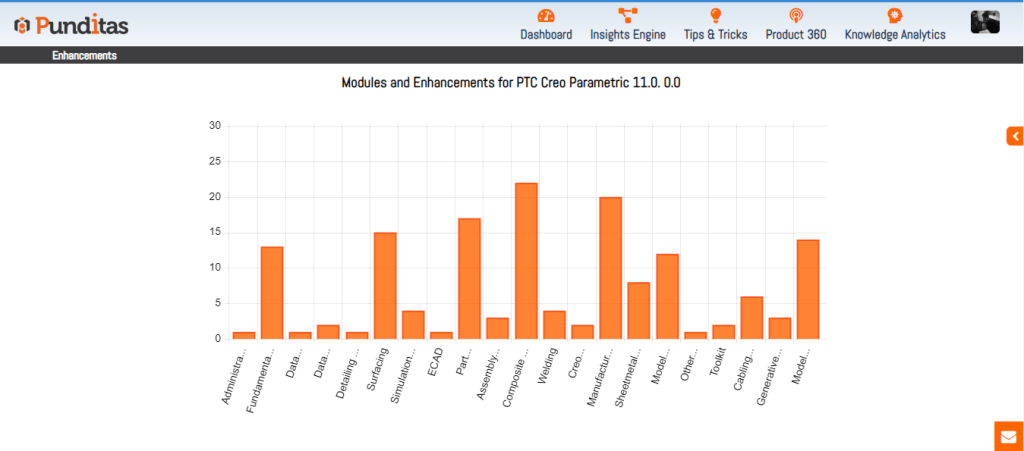
Punditas AI’s Chart View feature provides users with a dynamic and graphical representation of product data. This includes illustrating the relationship between different modules within a software product and showcasing the number of enhancements associated with each module. Unlike traditional text-based reports, the Chart View adds a visual dimension to data analysis, making complex information easier to understand at a glance.
Simplified Data Retrieval
The flexibility of the Chart View lies in its ability to simplify the retrieval of essential product information. Users can interact with the chart to explore different modules and their corresponding enhancements swiftly. This intuitive approach not only saves time but also enhances user engagement by presenting data in a format that is both informative and easy to navigate.
Strategic Insights for Decision-Making
The Chart View serves as a powerful tool for product managers, developers, and users across various roles. By visually representing product strengths, weaknesses, and areas for improvement, it enables stakeholders to gain strategic insights into product performance. This visualization transforms raw data into actionable insights, empowering users to make informed decisions that optimize their experience with the software product.
Advantages of Using Punditas AI’s Chart View
Enhanced User Experience
Punditas AI prioritizes user experience by offering a visually intuitive interface through the Chart View feature. By presenting complex data in a graphical format, users can quickly interpret trends, patterns, and relationships within the product data. This enhances user comprehension and facilitates more effective data-driven decision-making.
Actionable Insights
The Chart View converts data into actionable insights by highlighting key metrics such as module relationships and enhancement counts. This allows users to identify areas of focus for optimization, prioritize feature enhancements, and allocate resources efficiently. Ultimately, it supports proactive management strategies and enhances overall product development processes.
Strategic Planning and Optimization
For product managers and developers, the Chart View provides a strategic advantage in planning and optimizing product development cycles. By visualizing module-specific enhancements and their impact, teams can align development efforts with user needs and market trends more effectively. This proactive approach helps in staying ahead of competition and delivering products that meet evolving customer expectations.
Why Punditas AI?
Tailored Data Visualization
Punditas AI stands out by offering tailored data visualization that caters to the specific needs of software product users. The Chart View feature is designed to enhance user understanding and engagement, promoting efficient data exploration and facilitating informed decision-making across organizational levels.
Flexibility and Accessibility
With Punditas AI, users benefit from the flexibility to interact with data through intuitive interfaces like the Chart View. This accessibility allows for seamless navigation through product data, enabling users to extract meaningful insights and drive continuous improvement within their organizations.
When Punditas AI Can Be Helpful
Product Development Lifecycle
During the product development lifecycle, the Chart View aids in monitoring and analyzing module-specific enhancements. It supports iterative improvement processes by visualizing trends over time, guiding development teams in prioritizing features and optimizing software performance.
Strategic Reviews and Assessments
For strategic reviews and assessments, the Chart View provides a comprehensive overview of product strengths and areas for enhancement. It facilitates collaborative decision-making among stakeholders by presenting data in a format that is both informative and accessible.
Punditas AI’s Chart View feature represents a significant advancement in visualizing product data, offering users a powerful tool to gain insights, make informed decisions, and optimize their software experiences. By leveraging visual data representation, organizations can enhance productivity, streamline workflows, and achieve greater success in navigating the complexities of modern enterprise software environments. Embrace the Chart View to unlock actionable insights and propel your software product strategies forward with confidence and clarity.
What is Punditas AI Advisor?
Punditas AI Advisor provides real-time guidance as you work in the Creo environment. Information on “how to use” a feature in Creo or best practices for working with Creo are presented within context, removing the need to guess or search for such information. Punditas AI driven content helps you leverage Creo to create your designs faster and with confidence.
For more information about Punditas AI Advisor, visit our website at Punditas AI or contact us at contact@punditas.com

Leave a comment