
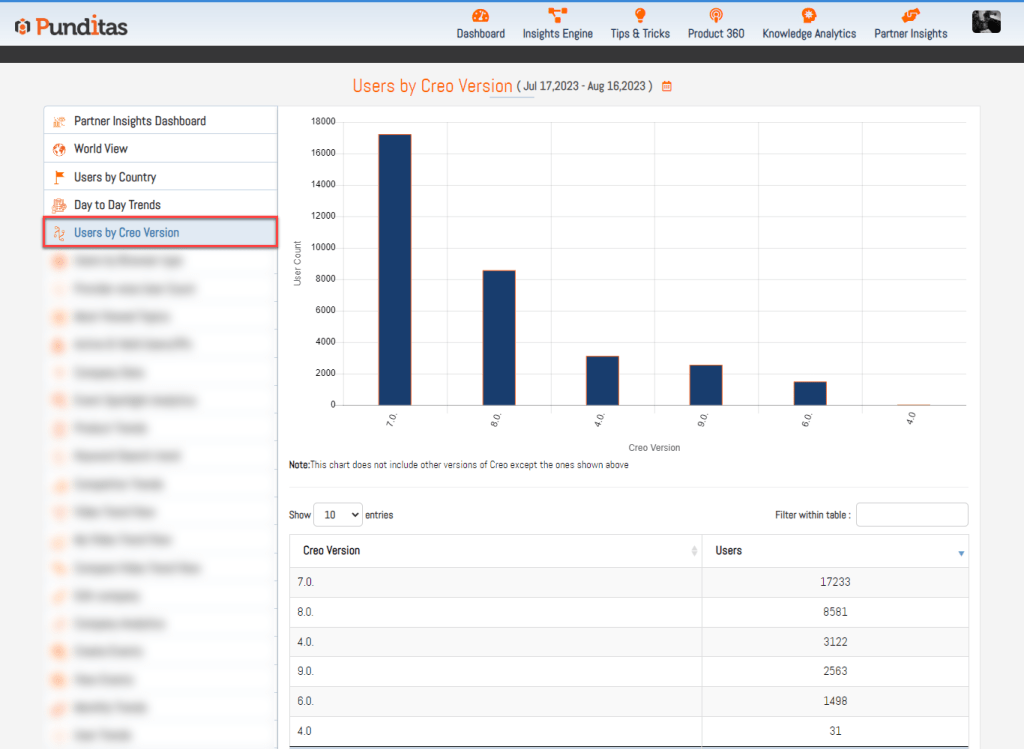
The “Users by Creo Version” section offers a graphical representation of users based on the specific versions of the Creo software they are using. This graph provides a clear view of the relationship between different Creo versions and the number of users for each version.
Key Features
- Graphical Representation:
- The graph displays the correlation between various versions of Creo and the number of users using each version.
- This visual aid helps understand how user engagement is spread across different versions.
- Table View:
- A detailed table lists the Creo software versions alongside the corresponding number of users.
- This format offers a quick and accessible way to see user distribution across different Creo versions.
Why This Information Matters
- Insight into Usage Trends:
- The combined visual and tabular data help stakeholders recognize trends in Creo software usage.
- Informed Decision-Making:
- Understanding which versions are most popular can guide support, development, and marketing strategies.
The “Users by Creo Version” section provides valuable insights into how users interact with different versions of Creo. By utilizing both graphical and tabular formats, this section makes it easy to understand usage patterns and make informed decisions based on these trends.
What is Punditas AI Advisor?
Punditas AI Advisor provides real-time guidance as you work in the Creo environment. Information on “how to use” a feature in Creo or best practices for working with Creo are presented within context, removing the need to guess or search for such information. Punditas AI driven content helps you leverage Creo to create your designs faster and with confidence.
For more information about Punditas AI Advisor, visit our website at Punditas AI or contact us at contact@punditas.com

Leave a comment