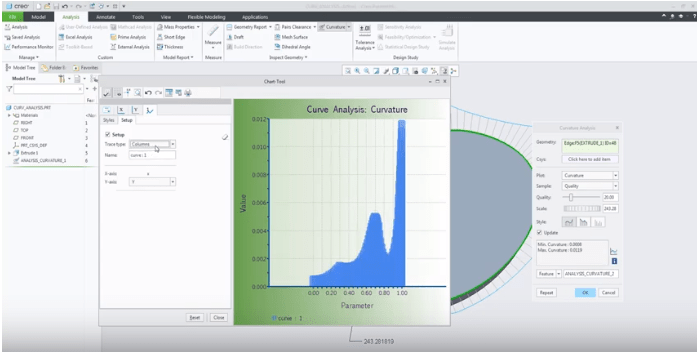
A new modernized Chart tool replaces Graph tool starting with Creo Parametric 6.0 release. Chart tool has more options and provides more control over the chart settings.
Chart-Tool can be used to view and customize different types of graphs. Once the graph is displayed, the graph can be changed for border colors, fonts, background colors, etc.

To learn more about how this works, refer to this video on YouTube
About Punditas
Punditas delivers AI driven content for PTC Creo Parametric and most Enterprise Application Softwares. Punditas AI engine taps into 100’s of internal & external repositories for Creo Parametric to Discover, Curate & Deliver pertinent Tips, Tricks, Tutorials, Best Practices, etc. up to 5 perspectives of content based on each Creo Users style and preference. To learn more about Punditas, visit https://www.punditas.com
Content source: PTC

Why would anyone care about fonts and background color??? What I want is the ability to specify the graph, or sections of the graph, as a certain type of equation of function, specifically for, say, a cam profile. I’m stuck on Creo 4 for now, but, is this possible in Creo 6?
LikeLike
Frank, let me double check if this is available in Creo 6. I’m not sure….
LikeLike